


All-time low, or ATL, sounds dramatic, and to be fair, sometimes it is. In crypto, ATL means the lowest price a digital asset has ever reached across its trading history. It is a simple idea, yet it carries a load of meaning. Traders watch it. Long-term holders watch it. Even casual users feel the ripple when a chart taps that line. You know what? The story behind an ATL can be more useful than the number itself.
So what does ATL really mean?
At its core, ATL is a historical floor. It is the cheapest recorded price since the asset began trading on exchanges. If a coin falls to its ATL, buyers have never seen it cheaper. That might sound like a green light. Still, price alone does not tell you why that level happened. Liquidity hiccup, exchange glitch, forced seller, market panic, token unlock, or a broken peg. The label ATL captures the outcome, not the cause.
Here is the thing. Markets remember dramatic levels. When an asset revisits a prior ATL, emotion runs hot. Some view it as a bargain. Others see it as proof something is wrong. Those reactions shape what happens next.
Why traders care about ATL
Because ATL sets a boundary. Many strategies use boundaries. If price approaches the lowest level on record, you can expect one of two things. A strong bounce, often fast and loud. Or a breakdown that opens a new range and fresh uncertainty. That uncertainty is part of the opportunity and the risk. Both live under the same roof.
Traders also like ATL for risk control. A clear lowest level lets you define a stop. If price closes below the old ATL, the thesis might be wrong. If it holds and prints higher lows, you have a simple structure to work with. The logic is clean. The execution is not always easy when candles are flying and hearts are racing.
How ATL shows up on charts
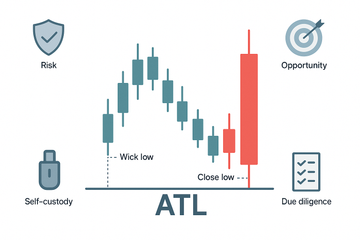
Not every ATL is created equal. On a candlestick chart, you will see wicks and bodies. A wick ATL is a quick pierce that snaps back. A close ATL comes from a candle body closing at a record low. Many traders trust closes more than wicks, since they reflect where buyers and sellers settled after the dust.
One more detail. Timeframes matter. A five minute ATL says very little. A weekly or monthly ATL speaks louder. If you are using TradingView, try marking the lowest weekly close, then compare it to the absolute lowest intraday wick. You might be surprised by how different those levels feel in practice.
Data quirks you should know
Crypto is messy. Early trading often happened on small venues with thin order books. A single odd print years ago might set an ATL that no serious capital could have filled. On top of that, different exchanges record different lows. CoinGecko and CoinMarketCap publish ATL data, but they sometimes vary by pair or venue coverage.
There is also token history. Redenominations, rebrands, chain migrations, or contract changes can reset the scale. A token that moved from 1,000 units to 1 unit can make the old ATL look meaningless. Always check the project’s docs and the pair you are charting.
ATL versus ATH, a quick contrast
ATL is the floor. ATH, or all-time high, is the ceiling. Cash comes in near ATH. Capitulation often visits ATL. Both levels are magnets. Both stir emotion. ATHs pull in momentum trades and headlines. ATLs bring value hunters and skeptics. Markets swing between those poles, sometimes for years. Neither level guarantees the next move, yet both frame the story.
Does buying near ATL make sense?
Sometimes. If fundamentals improved while price fell, a long-term position near ATL can have a nice margin of safety. If the project is shrinking, treasury is thin, and user figures are fading, the ATL might be a trap, not a gift. Do not forget fees, unlock schedules, treasury runway, and the core product. If the team ships and the community shows up, an ATL can be a stepping stone. If not, it can be a cold basement.
A simple method, and this is not advice, is to use a staged approach. Place small buys near old lows, then wait. If price confirms with higher highs and volume, add. If it keeps slipping, stop and reassess. You reduce regret on both sides, fear of missing out and fear of holding the bag.
Psychology at the bottom
Markets do not fall in straight lines. They sag, bounce, and grind. ATL often marks a moment when sellers are exhausted, yet patience is still thin. People feel lonely buying when everything looks bleak. That is normal. The opposite is also true. When a coin tags ATL on a panic, you might see a sharp relief rally. That can be pure reflex. Without new demand, price can slide back and test again.
Seasonal notes help too. Tax loss selling can push weak assets lower near year end in some regions. After big unlocks or vesting events, extra supply can lean on price. Understanding these rhythms will keep you steady when the crowd is noisy.
Tools to track ATL cleanly
Use multiple sources. Check CoinGecko and CoinMarketCap for ATL numbers. Compare them with your TradingView chart. If you work with on-chain data, Glassnode and CryptoQuant can add context through realized price, MVRV, or exchange flows. None of these are magic. They are lenses. Combine them and you will see more.
Set alerts near prior lows rather than staring at screens all day. Most platforms let you ping at price or percentage move. A simple alert can save you from emotional decisions, which, frankly, is half the game.
Self-custody still matters
ATL talk often mixes with buy zones and long holds. If you plan to hold coins for months, secure storage is part of the plan. Hardware wallets like Trezor and Ledger give you offline keys and clear signing. Price can swing wildly. Your keys should not. Keep recovery phrases safe. Double check addresses when you send. Small habits prevent big headaches.
Common mistakes around ATL
- Treating a single wick as gospel. Verify with multiple exchanges and higher timeframes.
- Ignoring liquidity. A low with tiny volume may not be repeatable.
- Forgetting token mechanics. Redenomination, supply changes, or vesting can warp old levels.
- Confusing cheap with good. Low price is not quality. Check product, team, and traction.
- Going all in on the first touch. Stagger entries. Let the chart confirm. Respect invalidation.
- Neglecting security. If you plan to hold, set up Trezor or Ledger, test a small send, and store the seed offline.
A quick checklist for ATL decisions
- Is this ATL confirmed by more than one source and timeframe?
- Does the project have real users or revenue, not just posts and hope?
- Are there upcoming unlocks, legal risks, or treasury issues?
- What is the plan if price closes below the ATL again?
- Where will you keep the asset, and have you tested your wallet flow?
Answer these with calm honesty. If the answers feel thin, size down. If the answers feel strong, set your levels and stick with them.
ATL and stablecoins, a small wrinkle
Stablecoins are a special case. An ATL for a stablecoin often reflects a depeg. Some rebounds quickly with liquidity support. Others never recover. Check reserves, attestation quality, chain risk, and historic stress events. If a stablecoin hits a new ATL far below its peg, treat that as a red flag until the peg is restored and volumes normalize.
Final thoughts, steady hands win
ATL is a compass point, not a prophecy. It shows where the market once broke. It hints at where nerves might fray again. Use it to plan. Pair it with fundamentals, timeframes, volume, and a clear exit. Keep your keys safe with tools like Trezor or Ledger. And remember, patience is a position. Sometimes the smartest move is to wait for price to show its hand.
Honestly, charts can feel loud. Let simple rules turn down the volume. Mark the ATL. Respect it. Then build your plan around what the market is actually saying, not what you wish it would say.


