


Have you ever watched a coin’s price rocket upwards, only to come crashing down the next day? Or maybe you’ve joined a crypto hype just when everyone seems to be buying—then found yourself wondering if you got in too late. If that sounds familiar, you’re going to want to meet your new trading buddy: the Relative Strength Index, or as everyone calls it, RSI.
What Is the RSI Anyway?
Let’s start with the basics. The Relative Strength Index is a technical indicator, invented back in the late 1970s by J. Welles Wilder. He wasn’t day trading Bitcoin, obviously—crypto didn’t exist back then—but his ideas about price momentum translate perfectly to our fast-paced coin markets.
The RSI tracks the speed and change of price movements for a digital asset, like Bitcoin or Ethereum. It spits out a number from 0 to 100, and with that simple readout, you get a surprisingly rich snapshot: Is this coin getting overhyped? Is it being ignored? Or is it just humming along, waiting for its next move?
So How Does It Work?
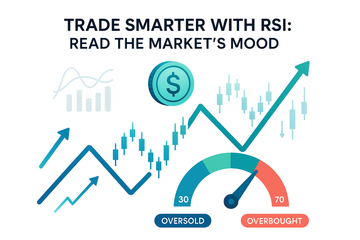
Here’s the thing: The RSI isn’t magic, but sometimes it feels pretty close. When the RSI climbs above 70, it’s sending a signal: this asset might be overbought. Translation? Maybe too many folks have jumped aboard, pushing the price higher than seems reasonable. On the other side, if the RSI dips below 30, the asset could be oversold—meaning traders have bailed in droves, perhaps beyond what is fair based on the project’s fundamentals.
Those ranges—above 70 and under 30—spark all kinds of questions. Should you buy when it hits 20? Or sell at 80? (We’ll get there in a minute!)
Why Crypto Traders Love RSI
Honestly, what’s not to love? In a market known for nail-biting volatility, RSI gives traders a calm, collected way to read the room. It helps spot “mood swings” in the market—a period where greed or fear takes hold—and lets savvy folks decide when to step aside, or jump in.
- It’s quick to spot hype cycles. When influencers or whales start piling into a coin, the RSI goes wild. That’s your cue to stay sharp.
- It helps you avoid panic selling. Sometimes prices fall hard, but a low RSI number can tip you off that the market’s reaction is overdone.
- Ideal for short-term trading. Since RSI reacts swiftly to price changes, it’s tailor-made for swing traders and scalpers hunting those quick wins.
Even folks using hardware wallets like Trezor or Ledger nod to the RSI when planning their long-term crypto storage. You never know when you’ll want to move coins to cold storage at a juicy price.
Real-Life RSI: A Quick Example
Picture this: You’re eyeballing Ethereum. The price has jumped 18% in just three days, and the RSI flashes 82. You pause. Is it smart to buy now, or is the “fear of missing out” (FOMO) taking over? That high RSI could mean the market’s due for a breather. Maybe prices will cool, offering a better entry point. The RSI nudges you to ask, “Is this fire real, or just a spark?”
But don’t take RSI’s word as gospel. Sometimes coins ride high RSI levels for ages before correcting. It’s more of a heads up, less of a crystal ball.
The Secret Sauce: Combining RSI With Other Tools
Honestly, most successful traders don’t rely on RSI alone. Think of it as checking the weather before heading out—it says rain looks likely, but you’ll still glance out the window. Traders typically pair RSI with:
- Moving averages—show long-term price trends.
- Bollinger Bands—highlight price volatility and can flag extreme conditions.
- Support and resistance levels—suggest where a price bounce or drop might pause.
Even old-school chart patterns—like head and shoulders or double bottoms—get a fresh twist when viewed alongside RSI. It’s like baking: an egg on its own isn’t much, but mix it with flour and sugar and suddenly you’ve got cake. Or, in this case, a much tastier trading strategy.
Common Pitfalls: Don’t Let RSI Fool You
If RSI is so great, why doesn’t everyone win all the time? Simple. Markets, especially crypto, love to play tricks. Coins can ride “overbought” or “oversold” conditions for much longer than you expect. Sometimes an asset stays above 70—way above—for weeks. Or it mopes along under 30 until you start doubting your charts.
Plus, RSI is less reliable in trending markets. When everything’s moving in one direction, the indicator can start giving “false alarms,” warning of reversals that don’t materialize. That’s where combining indicators, or taking a step back to ask, “What’s driving these moves?” really helps.
Tips to Master RSI—Crypto Style
Let’s not pretend you’ll become a chart wizard overnight, but a few pointers can go a long way:
- Adjust the time frame. The default RSI looks at 14 periods, but lowering to 7 or bumping up to 21 can make it more (or less) sensitive.
- Watch for divergence. When the price makes a new high but the RSI doesn’t? That’s a whisper of possible reversal. Keep your ears open.
- Stick to your plan. No indicator replaces a good risk strategy, especially in crypto’s wild west. Trezor and Ledger users know: safety first, gains second.
“Follow the rules, but bend the guidelines.” That’s what an old trader once told me. RSI is a fantastic tool, but it’s not a fortune teller. Expect surprises.
The Takeaway: RSI in the Wild World of Crypto
If you’re still here, congratulations—you’re way ahead of most meme-coin chasers. The RSI gives you a peek into the emotions and momentum swirling beneath those wild price charts. Used wisely—and with a dash of healthy skepticism—it can help you dodge the herd, spot opportunities, and trade with a little more confidence.
And hey, when things get stormy in the markets, sometimes just knowing you have an extra tool in your belt makes the ride a little less bumpy. So fire up your favorite chart, tap the RSI button, and see what the market’s mood is telling you today. Who knows? You might just spot your next winning move before the crowd does.
Happy trading—and stay curious out there! The crypto frontier is wild, but a little wisdom (and a lot of patience) go a long way.


